Assignment 6 - Datalogging
Geon Soo Park
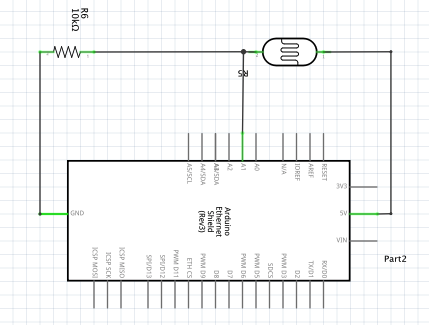
Schematic
For the photoresistor, I used 10k resistor. The maximum current allowed to go into the ground pin is 200mA and I chose 5V for the power. R = V/I = 5v/0.02A = 250a. We need a resistor bigger than 250a. Furthermore, we need to use a resistor divider to allow the high impedence Anlog input to measure the voltage. We need to use the formula: Vout=Vin*(R2/(R1+R2)) to find the value for Vout. Vin is the 5V, R6 is 10k ohm, and R5 is the photoresistor(10k ohm).
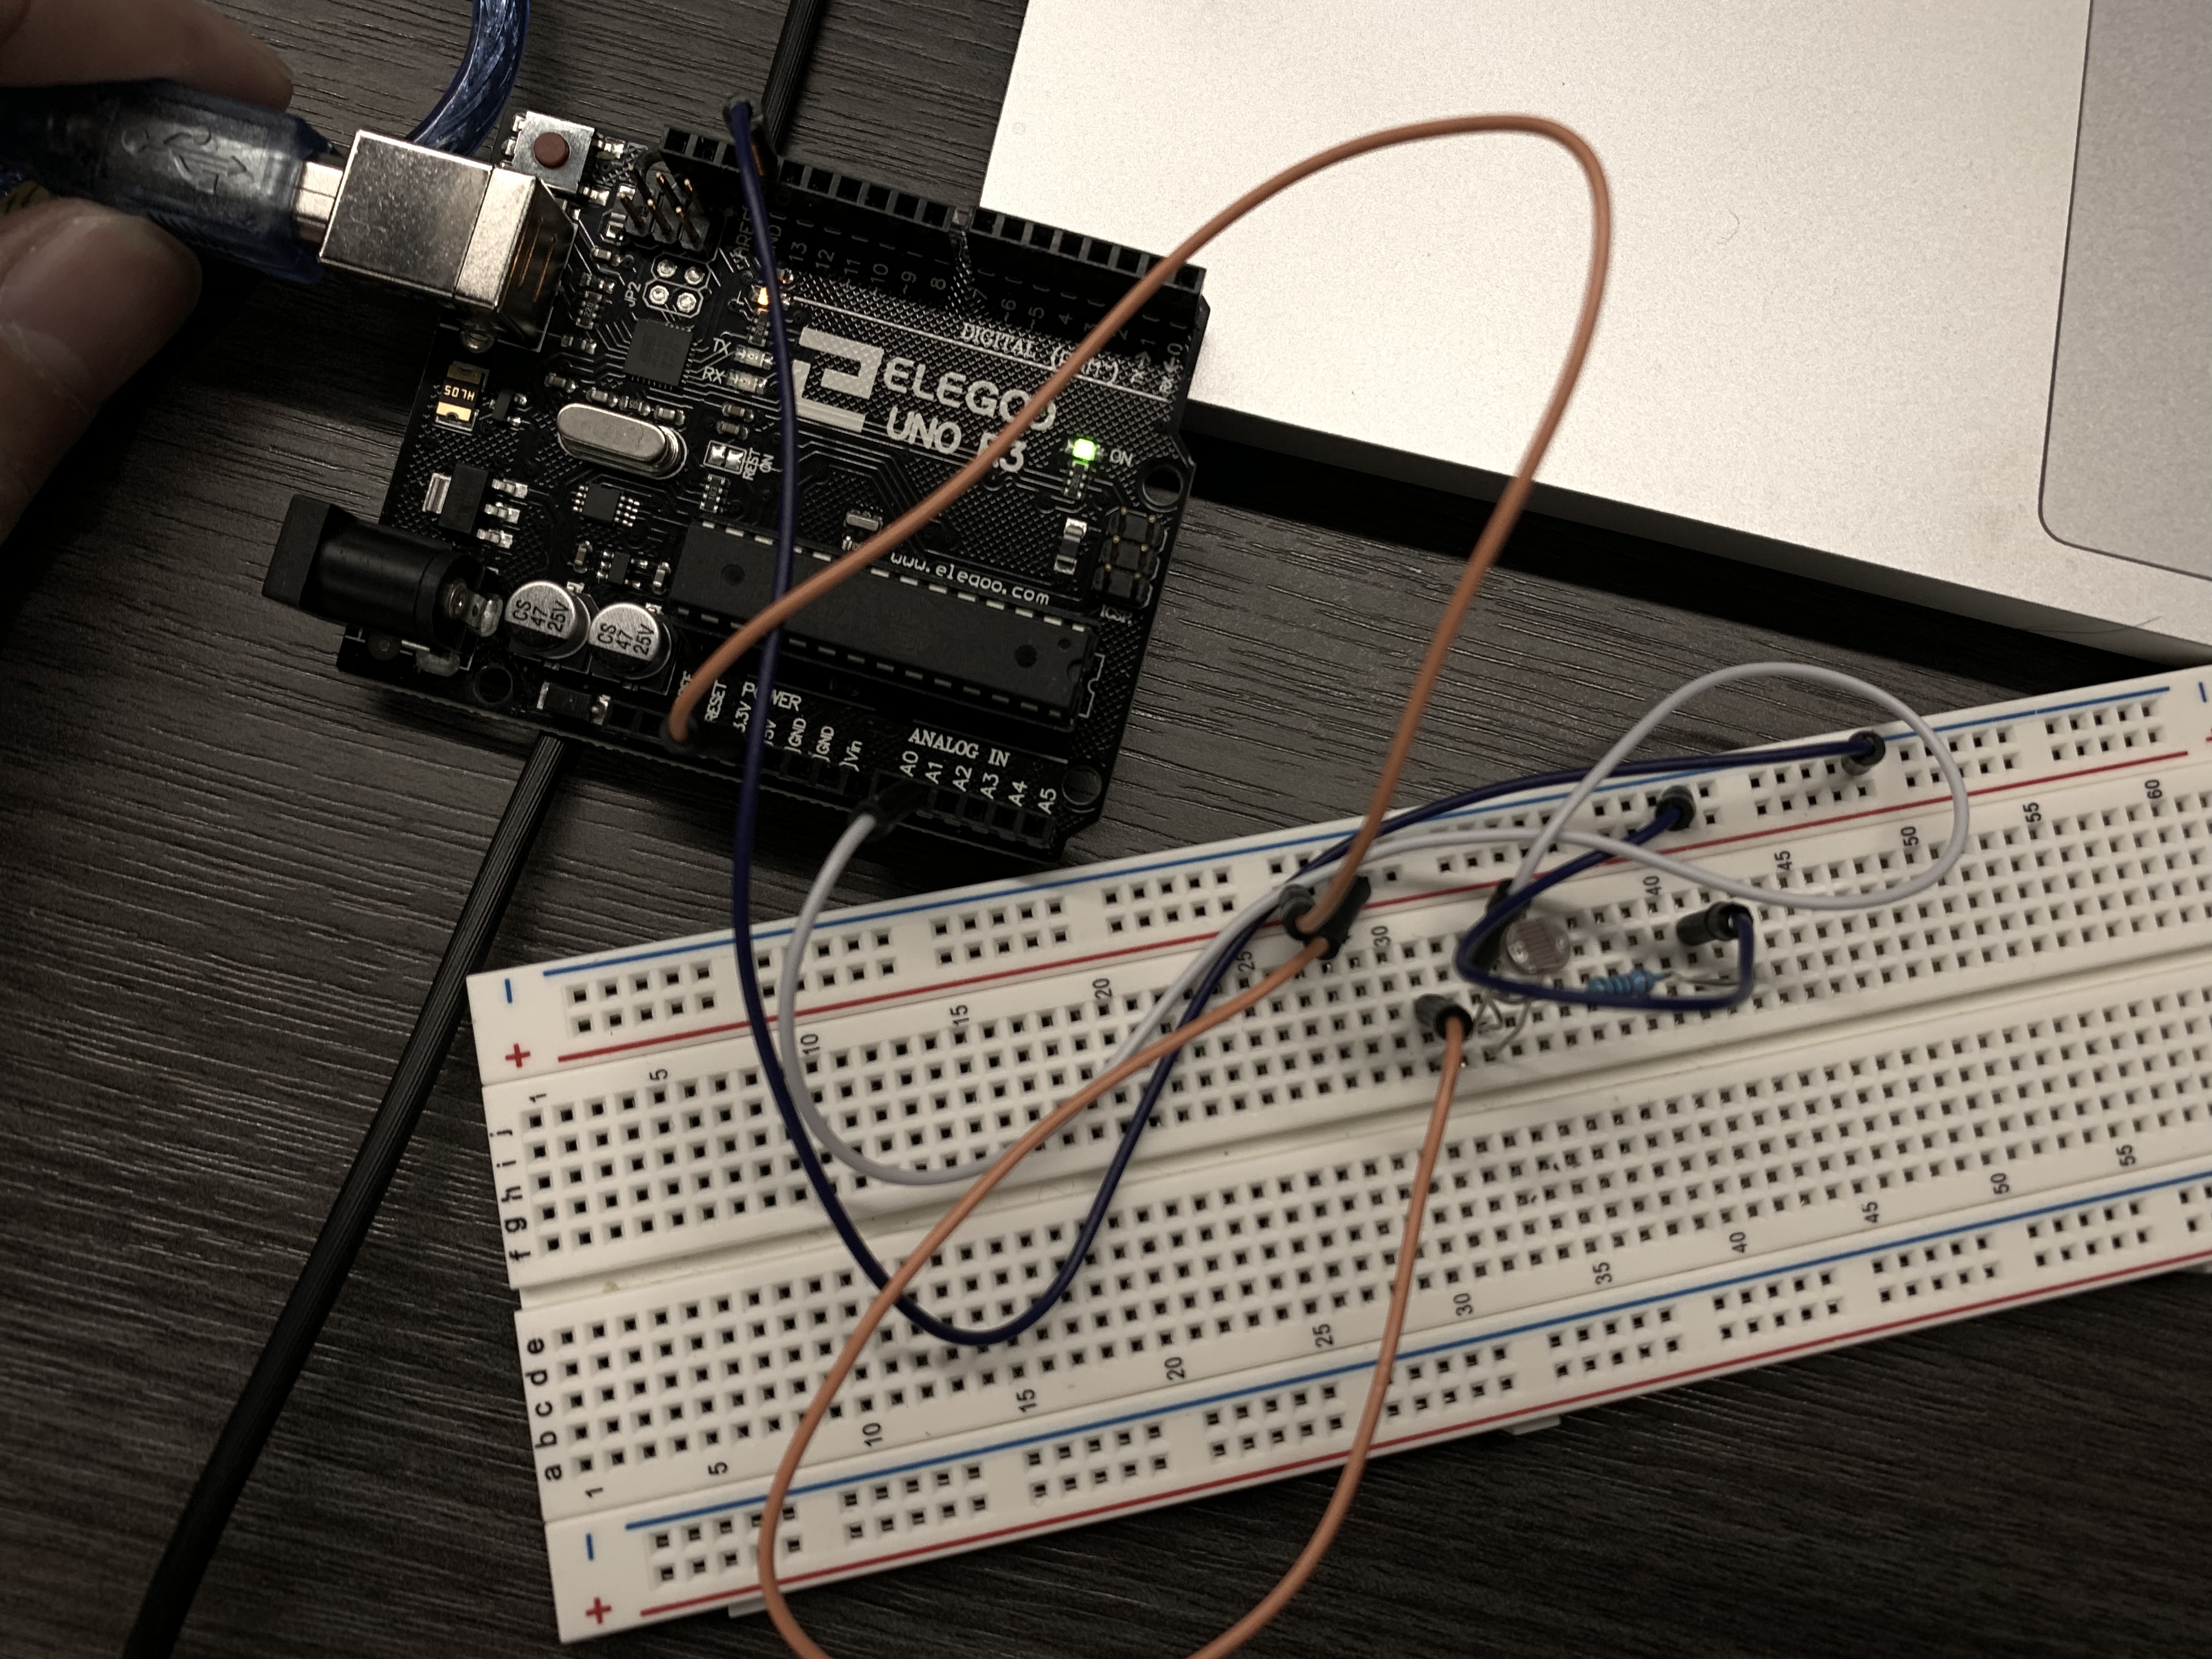
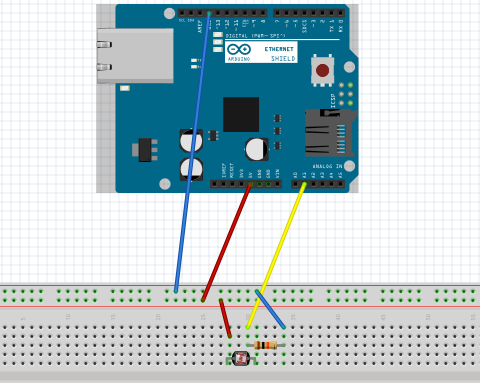
Circuit
The photoresistor is connected to the 5V power pin and the ground pin. Also, I chose A1 for the input pin to get the data from AnalogRead().
* AnalogRead() returns a number betwen 0 and 1023 and it is proportional to the amount of voltage being applied to the pin.
Firmware
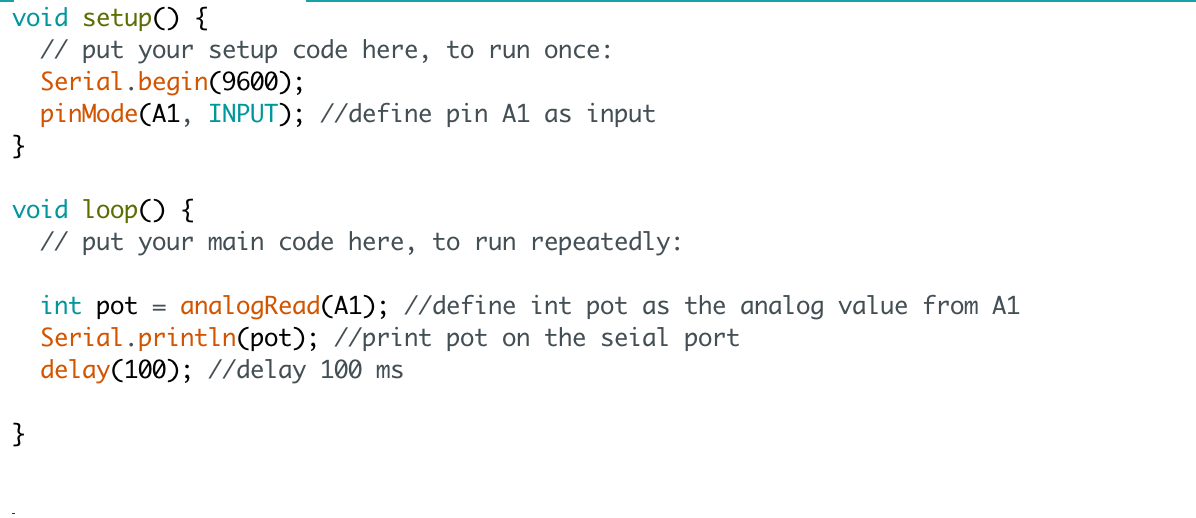
Code 1 - Arduino
First code is a code that I wrote for Arduino. I set A1 as the input and it reads the analog data from photoresistor. It prints out the data from photoresistor and displays on the serial port. Lastly, it delays 100 ms in every loop.
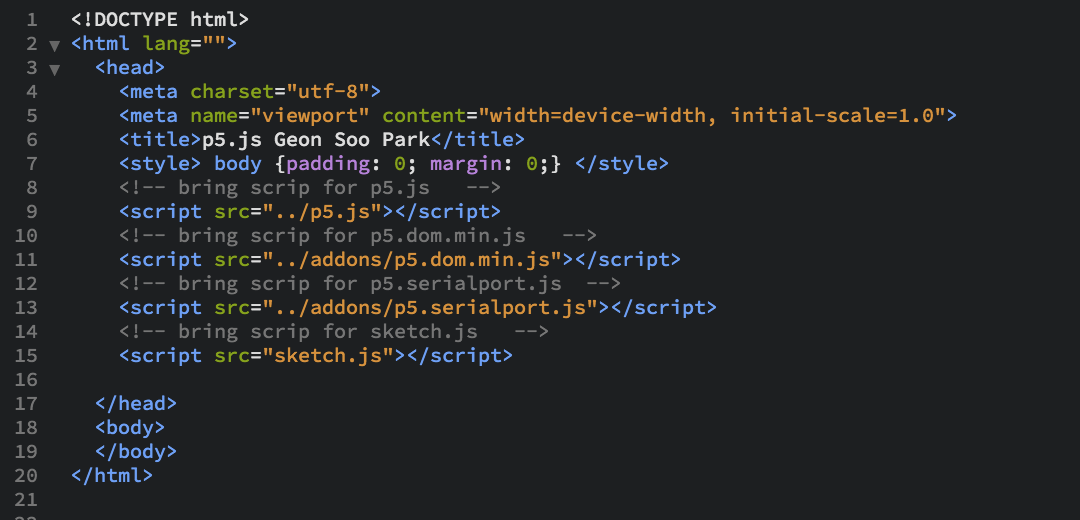
Code 2 - Index
This code is a html code for the interactive webpage. In the index.html, it reads four scripts: p5.js, p5.dom.min.js, p5.serialport.js, and sketch.js.
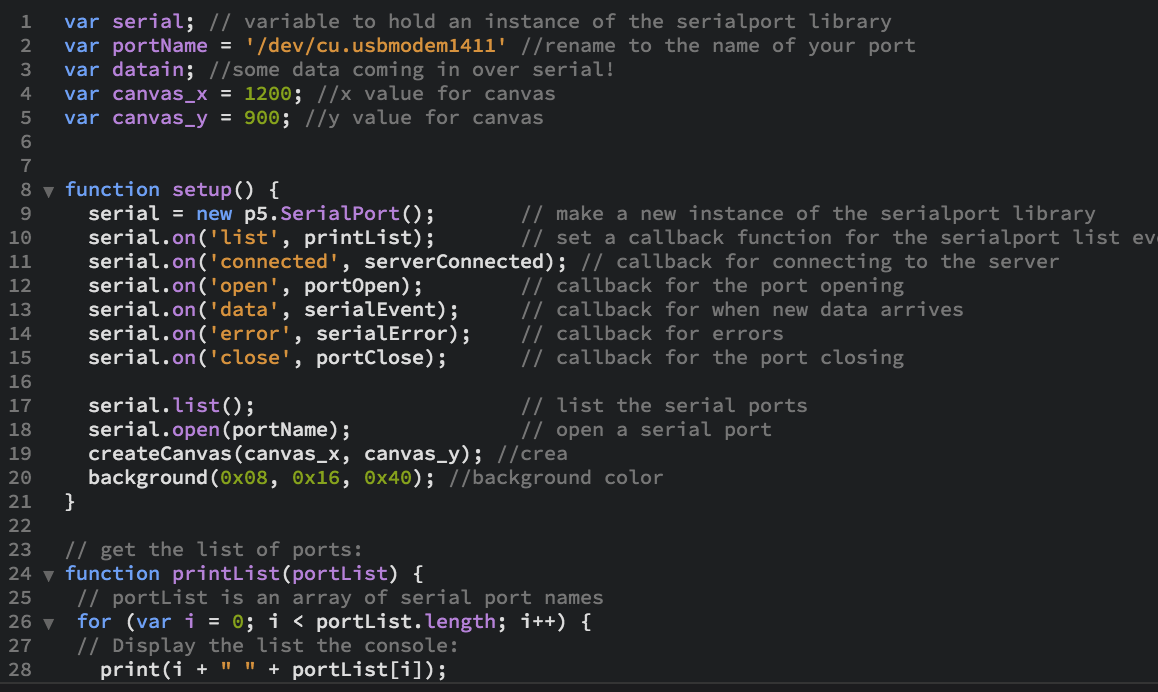
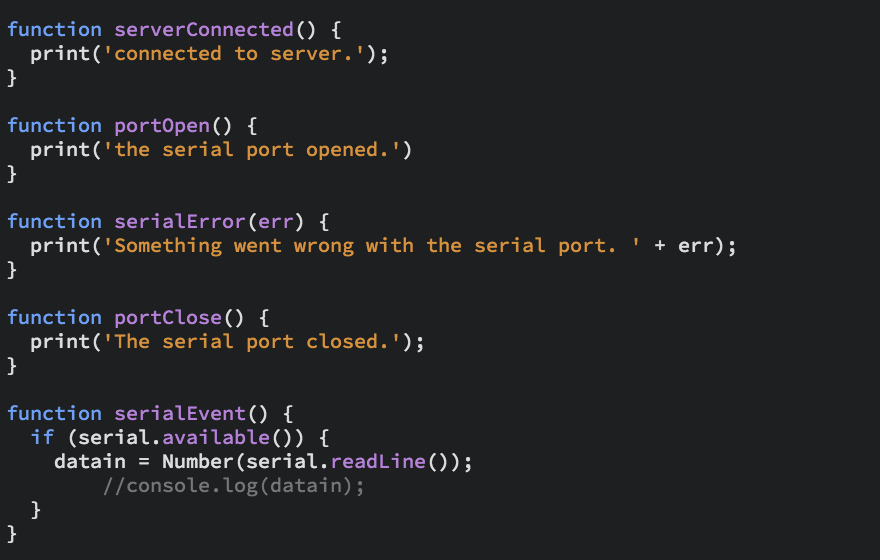
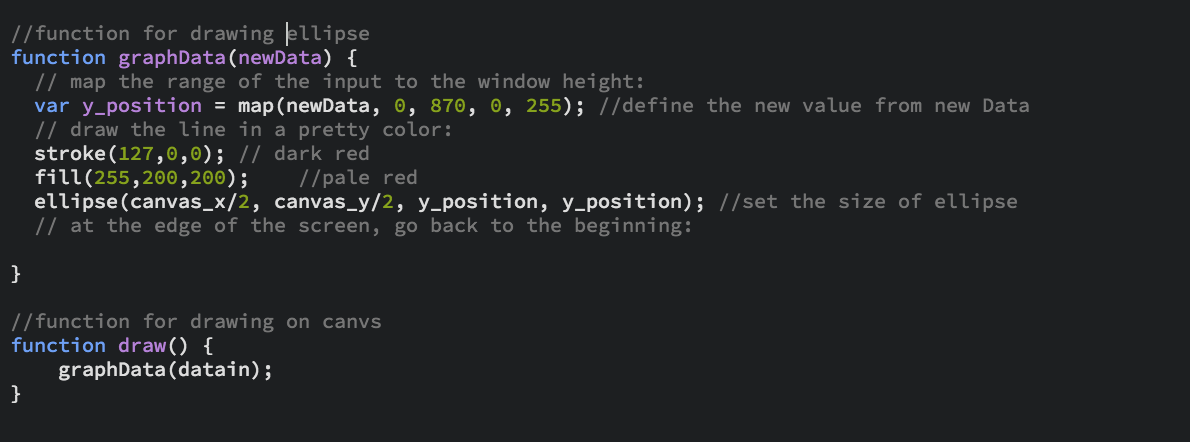
Code 3 - Sketch.js
This is a sketch.js that gets the data from the serialport library and use that data to draw ellipse. I set the value for the x and y values for canvs size. In the graphData function, I used the map function to set the min and max (from 0 ~ 870) value for the graph. Then, I chose the stroke color to be dark red and ellipse color to be pale red. Lastly, in the ellipse function, the x and y size should be depend on the data value and the position should be located in the center of the canvs. The draw function draws ellipse. This is a sketch.js that gets the data from the serialport library and use that data to draw ellipse. I set the value for the x and y values for canvs size. In the graphData function, I used the map function to set the min and max value for the graph. Then, I chose the stroke color to be dark red and ellipse color to be pale red. Lastly, in the ellipse function, the x and y size should be depend on the data value and the position should be located in the center of the canvs. The draw function draws ellipse.
Operation
I made a webpage that interacts with the data from photoresistor. By using the sketch.js, I made an ellipse that changes the size by the size of the data it receives. For example, the photoresistor sends the value between (0 ~ 870) depends on the light intensity. If the value is bigger than it draws a bigger ellipse. Moreover, the second gif shows the data that sends from photoresistor on the serial port.
Thank you and have a nice day!